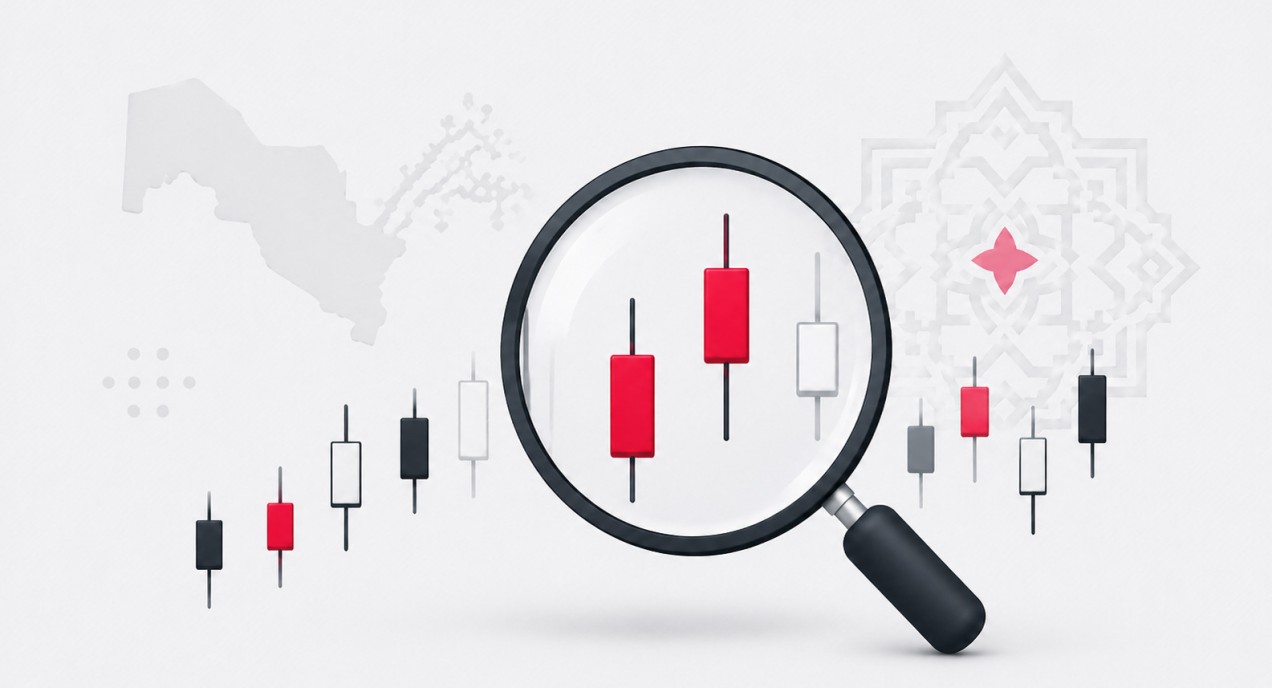
Japanese candlesticks were invented by rice traders in the 18th century, and today they are the standard for displaying prices on any exchange in the world. One candle contains four data points and shows who won the battle over a chosen time period — buyers or sellers.
Candle Anatomy
Each candle shows the opening price, closing price, high, and low for a period — a minute, hour, or day. The candle body is the distance between the open and close. The wicks are the extensions to the high and low.
- Green (white) candle — close above open; buyers won the period.
- Red (black) candle — close below open; sellers dominated.
- Long body — strong movement, confidence from one side.
- Long wicks — struggle and uncertainty.
Single Candle Signals
- Doji — body nearly absent, open equals close. Market indecision; after a strong trend, often signals a reversal.
- Hammer — small body on top and long lower wick after a decline. Sellers pushed, but buyers recovered the price — signal for growth.
- Hanging Man — mirror image of hammer at the peak of a rally: long upper wick, small body. Hints at a downward reversal.
- Marubozu — candle without wicks. One side completely controlled the period; trend is strong.
Multi-Candle Patterns
- Engulfing — second candle completely covers the body of the first in the opposite direction. Bullish engulfing at the bottom of a trend — strong buy signal.
- Morning Star — three candles: long red, small with gap, long green. Classic upward reversal.
- Evening Star — same at the peak, downward reversal.
- Three White Soldiers / Three Black Crows — three consecutive long candles of the same color, confirming trend strength.
How to Use Correctly
- Context matters more than the candle. A hammer in the middle of a sideways move means nothing; a hammer at a strong support level means a lot.
- Wait for confirmation. A reversal pattern should be confirmed by the next candle moving in the right direction.
- Check volume. A candlestick signal on high volume is more reliable.
- Higher timeframes are more important. A daily candle carries more weight than an hourly one.
Common Mistake
Beginners memorize dozens of patterns and see them everywhere. On illiquid securities — which is most local stocks — candles form on individual trades, and any 'pattern' may simply be random. Start with 4–5 of the most reliable patterns and apply them only to liquid instruments.
Bottom line: candles are the language of the market. Learning a few basic 'words' is enough to understand who is stronger right now — buyers or sellers — and avoid trading against them.